Recording Physics Practical Observations in Tables

In a physics practical, the observation table is the evidence for everything that follows, because every calculation, graph, and conclusion is built on the readings it contains. A table that is headed clearly, filled in honestly, and easy to read lets the examiner check your work quickly and trust your result, while a cramped or careless table casts doubt on the whole experiment. Good tables are not about beautiful handwriting alone; they are about planning the columns before you measure, recording units every time, and repeating readings so that odd results stand out. This guide shows how to set out physics observation tables that are clear, honest, and ready for calculation.
Plan the Table Before You Measure
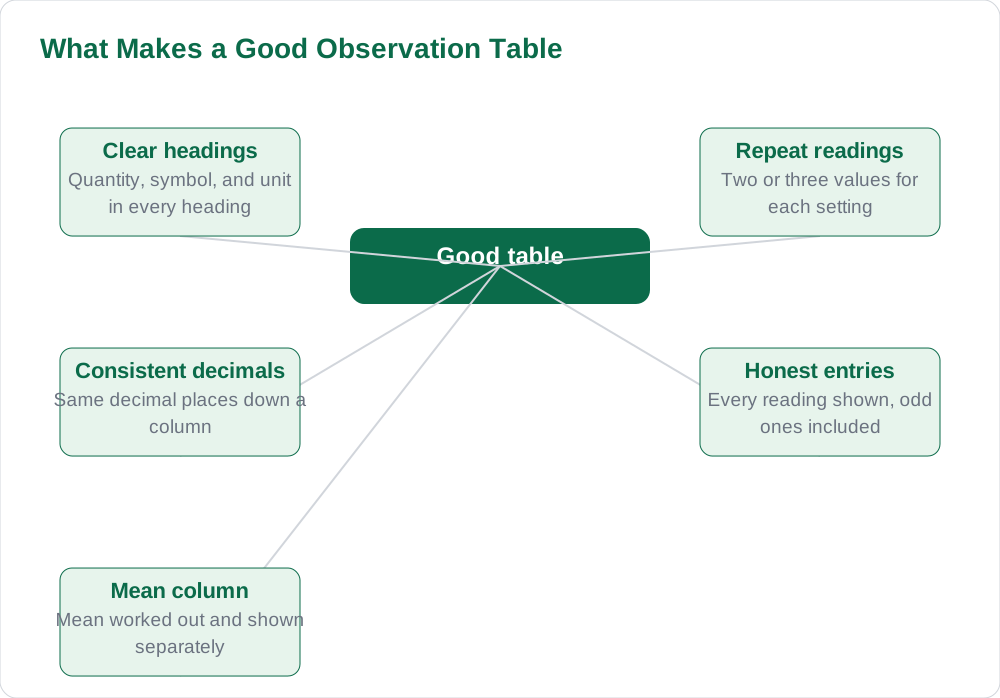
Draw the observation table before you take a single reading, because a table planned in advance stops you from forgetting a column halfway through the experiment. Look at the quantities you will vary and the quantities you will measure, and give each one its own column, with the quantity, its symbol, and its unit written in the heading, for example length in centimetres or time in seconds. Leave a column for repeat readings of the same measurement, since physics practicals usually require two or three readings for each setting, and add a final column for the mean if your teacher asks for one. Planning the table first also shows you whether you have enough rows for all the settings you plan to test.
Rule the table with a ruler and leave enough width in each column for the numbers you expect, including decimal places, so entries do not spill into neighbouring columns. Write the headings once, neatly, and do not rewrite them for every row, since repeated headings waste space and invite errors. If the experiment needs a separate table for a different part, such as a second set of readings, draw it as a new table with its own heading rather than squeezing it into the first one. A table planned before measuring is faster to fill in during the experiment, when your attention should be on measuring carefully, not on deciding what to write where.
Headings, Units, and Decimal Places
Every column heading in a physics table must show the quantity and its unit, because a number without a unit cannot be checked or used in a calculation. Write the unit in the heading once, for the whole column, rather than repeating it after every number, which clutters the table and makes comparison harder. Use the unit your teacher or apparatus uses, and keep it consistent through the whole table; mixing centimetres and metres in one column is a common source of calculation errors. If you convert a unit during the experiment, note the conversion clearly so the examiner can follow it.
Record readings to a sensible number of decimal places, matching the precision of your measuring instrument, and keep the same decimal places down each column. A ruler marked in millimetres justifies readings to one decimal place in centimetres, while guessing extra digits beyond what the instrument shows is false precision, not accuracy. Write numbers plainly, with decimal points clearly placed, and avoid writing a digit over another one when correcting an entry; cross it out with a single line and write the new value beside it. Consistent units and decimal places make the table look professional and make the calculation that follows far less error-prone. For more study material, see the solved notes and the book collection.
Repeat Readings and Taking the Mean
Repeat readings are the simplest way to catch mistakes in a physics practical, because a single reading can be wrong without you noticing, while three readings that disagree point straight to a problem. Take each reading independently, resetting the apparatus or your eye position between repeats where possible, rather than copying the first value three times, which defeats the purpose. Record every repeat in its own column, even if one looks odd, because hiding an awkward reading is dishonest and examiners notice gaps in a table. If a repeat is clearly wrong, for example because you misread the scale, note it briefly and repeat the measurement properly.
When the repeats agree closely, calculate the mean by adding them and dividing by the number of readings, and write the mean in its own column to the same decimal places as the readings. The mean is the value you carry into calculations and graphs, since it smooths out small random variations in measuring. If the repeats differ widely, do not just average them and move on: check the apparatus, your technique, and whether something changed between readings, and record what you found. Explaining a spread of readings honestly is far better than presenting a tidy mean built on hidden data, and it shows the examiner that you understand measurement, not just arithmetic.
Recording Observations During the Experiment
Record readings directly into the notebook table as you take them, never on loose paper to be copied later, because copying introduces errors and loses the link between reading and setting. Read the instrument at eye level where parallax matters, such as with a metre rule or a liquid column, and record the value before moving on to the next setting. If you must estimate between scale divisions, do so consistently and note that the last digit is estimated, rather than pretending the instrument is more precise than it is. Working steadily, one setting at a time, also prevents the common mistake of recording a reading against the wrong row.
Keep the table tidy as you go by writing numbers in the centre of each cell and leaving no cell blank without explanation. A blank cell looks like a forgotten reading, so if a reading could not be taken, write a short note such as apparatus fault and record what you did about it. At the end of the readings, scan the table for patterns: values should usually change smoothly as the varied quantity changes, and a sudden jump often means a misread scale or a wrong row. Catching that jump during the experiment, when you can remeasure, is worth far more than a neat table of unchecked numbers.
From Table to Calculation and Result
A good observation table leads naturally into the calculation, because the examiner can see exactly which numbers were used and where they came from. Show one worked calculation step by step, using the mean values from the table, and state the formula you used before substituting numbers with units. Do not present only a final answer, since the working is what earns marks and what lets an error be traced to a single step rather than blamed on the whole experiment. If a calculation is repeated for several rows, show the first one fully and then present the rest in a results table with the same care as the observations.
Finish by comparing your result with what you expected and commenting briefly on the agreement, without overstating it. If the result is close to the expected pattern, say so and note the small scatter in the readings; if it differs, suggest a specific reason from your observations rather than a vague excuse. The result section should refer back to the table, for example by naming the range of readings used, so the whole write-up hangs together as one argument. When the table, calculation, and conclusion agree with each other, the examiner can follow your thinking from measurement to result without guessing. More practical guides are on the blog and the [home page](/).
AI Help: Muse AI
Muse AI is Meta's personal AI assistant, and it can help you design a physics observation table by suggesting column headings with units and repeat-reading columns for your experiment. Try asking it for a blank table layout for a measurement you are about to do, then draw it in your notebook before the practical.
Join Muse with invite code LTGSWD — in the Muse app, go to Settings > Redeem token and enter the code.
Disclosure: LTGSWD is the author's Muse invite code.
Muse AI does not give official STBB answers — always verify against your Sindh Textbook Board book and your teacher.
5 key points you must know
- Draw and head the table before taking any readings.
- Put the quantity, symbol, and unit in every column heading.
- Take two or three independent repeat readings for each setting.
- Record readings directly in the notebook, never via loose paper.
- Show one full worked calculation from the table's mean values.
Frequently asked questions
Why do physics tables need repeat readings?
Repeat readings reveal mistakes and random variation that a single reading hides. If repeats agree closely, their mean is a more reliable value for calculations and graphs than any one reading alone.
Where should units go in an observation table?
Put the unit in the column heading once, for the whole column, such as length in centimetres. Do not repeat the unit after every number, and never mix two units in the same column.
How many decimal places should I use in a table?
Match the precision of your instrument and keep the same decimal places down each column. Do not invent extra digits beyond what the instrument can actually show.
What should I do with a reading that looks wrong?
Record it honestly, check the apparatus and your technique, and repeat the measurement properly. Note briefly what happened rather than hiding the odd reading, since examiners notice gaps.
Should calculations use single readings or means?
Use the mean of the repeat readings for each setting, and show one full worked calculation with the formula, substitution with units, and the result.
Solved notes — preview free
These guides work best with the solved exercises. Preview the solved notes free on this website — 119 solved notes for Classes 6–10 in Sindhi, Urdu, English and Arabic medium. Or browse the full solved notes catalogue for your class and medium. New solved notes are added regularly — check the catalogue for coming-soon books.